
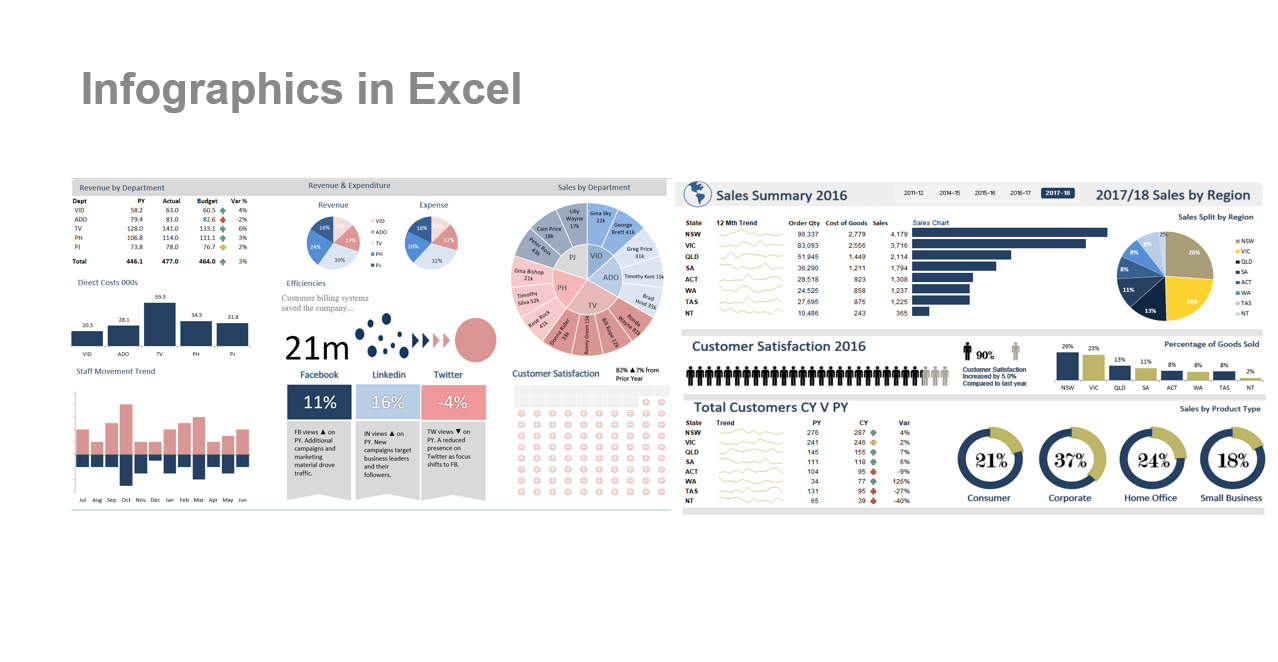
Introduction to Financial Infographics in Excel
Infographics has grown in importance in the business environment. One of the most powerful aspects of an infographic is to help readers understand information more quickly. In this webinar you will learn design techniques to present key financial information which highlights important organisational messages in a changable Excel file. These techniques can be applied for any file you create.
The series takes you through the
Build a key financial indicators infographic which is visually appealing.
The dos and don’ts of infographics – so more people will understand your message.
Lesson 2
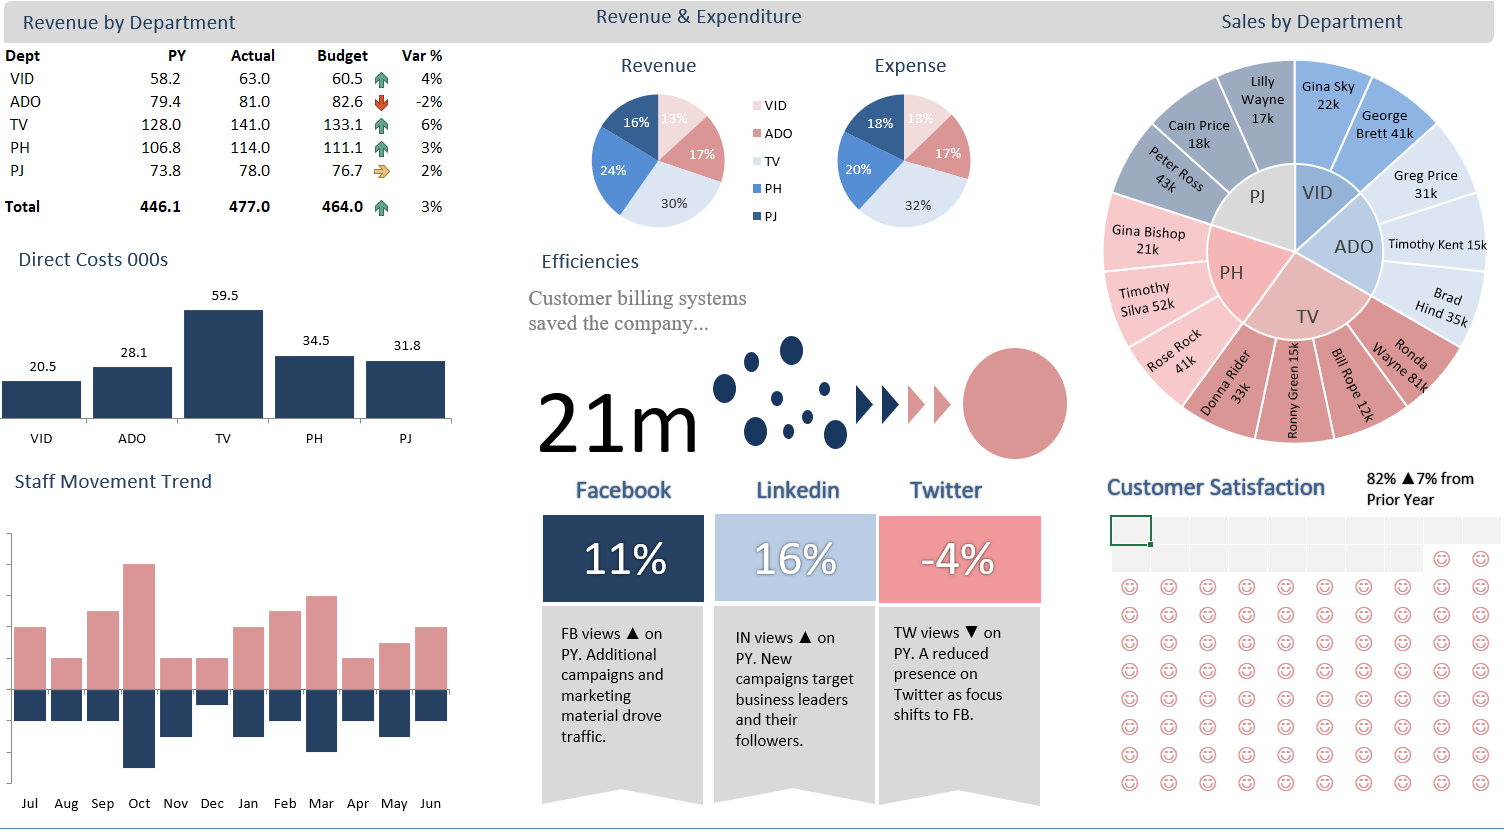
Revenue and Expense Infographics in Excel
This Infographics will have an acute focus on the income statement and extract key data points and trends to display in a stunning infographic. In this webinar:
Take a set of company financials and highlight the key messages in a structured logical infographic.
Display the revenue and expense data in a one page infographic which will instantly catch the user’s eye.
Build the revenue and expense data around a key organisational picture which tells a compelling story.
Lesson 3
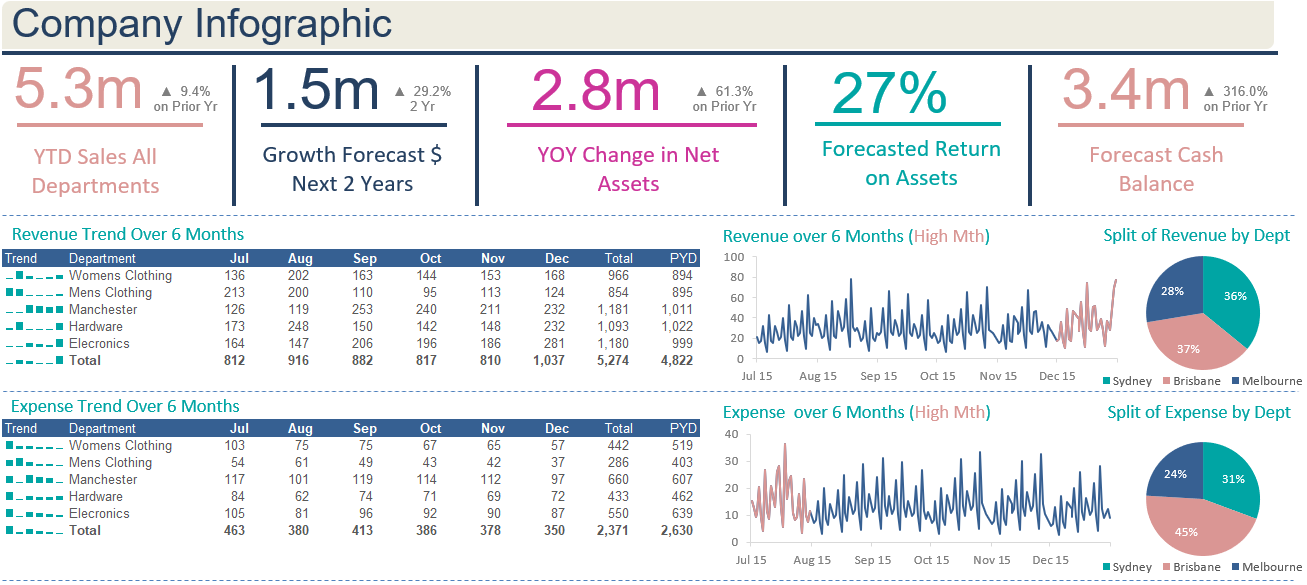
Whole of Organisation Infographic in Excel
This holistic infographic will take key data points form the organisation’s annual report and create an internal infographic highlighting the main points. In this webinar:
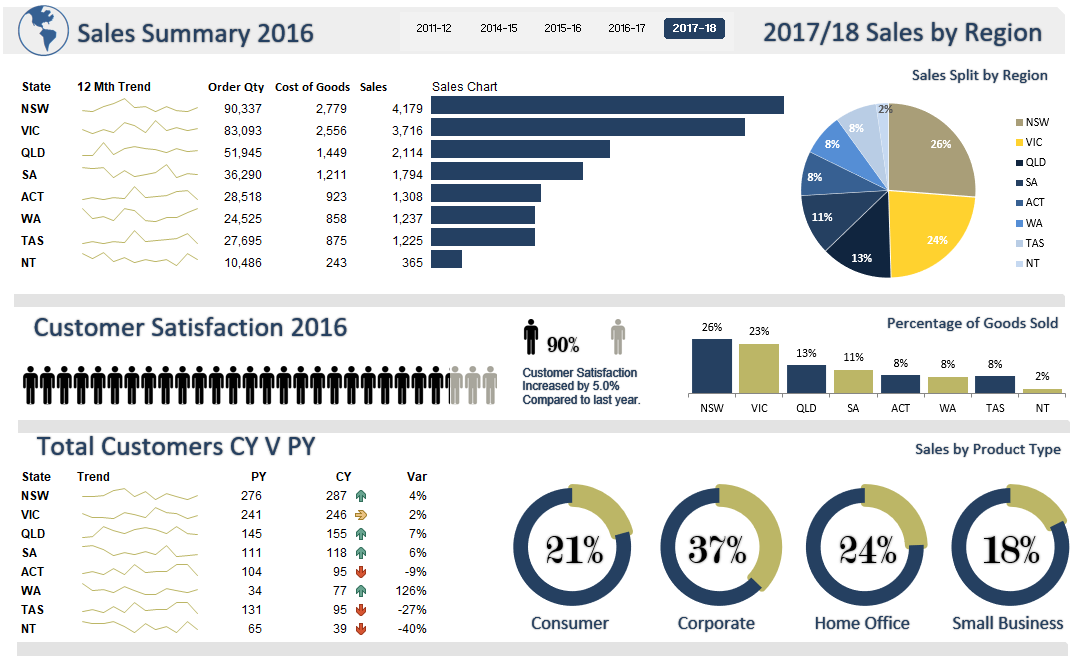
Create a broad infographic which looks at the health of an organisation, staffing, income, expenses key operational information.
Create a chart which will display people, change the number of people and the infographic will change accordingly. This technique is interchangeable and can be used in every day reporting.
Learn how to organise and display charts and pictures to create a digital marketing story for your organisation.
This Excel training course is suitable for those who work on Excel and who want to become familiar with and master the Excel tools, formulas and functions necessary for building effective robust flexible financial models.
The following is the course on the Eloquens platform.