National Excel Dashboard
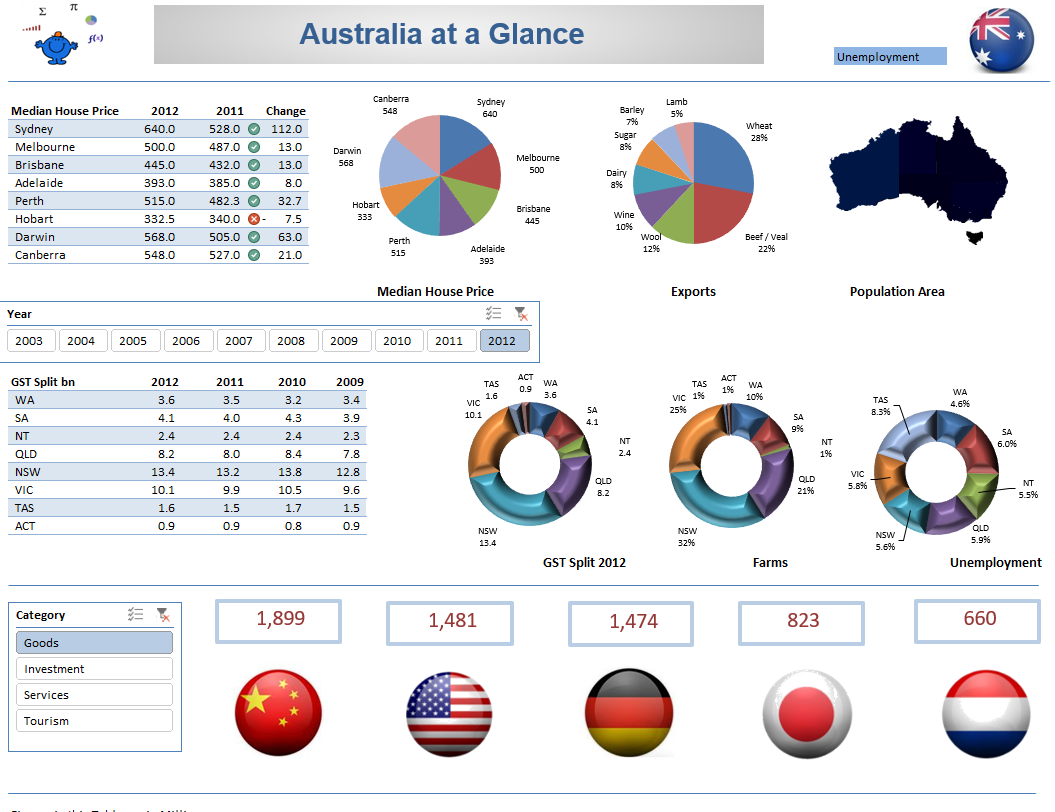
This heat map Excel dashboard has a heat map of Australia which changes according to the selection made in the drop down. The dashboard displays key metrics from Australia such as the split of the GST between States and Territories, key export markets and trade partners. The dashboard has a slicer at the bottom which allows different selections, the flags next to the slicer will change based on the selection. The technique for this can be found on the Toggle Chart page. The dashboard will work on Excel 2010 and later.
For a listing of all Excel Dashboards on the Smallman.com visit this link. There are more Excel files than you will be able to view!! However, the sample should give you insight into what is possible with Excel. Excel dashboard creation should be fun and creative, be consistent with your colours, try to align elements of your dashboard, group like items together to ensure flow and get others involved in the process. Group think always produces a more informed outcome.
The following file is a macro enabled workbook and my web provided only allows xls or xlsx workbooks. The Excel dashboard and its supporting data should be easy to follow.