Sparklines Excel Dashboard
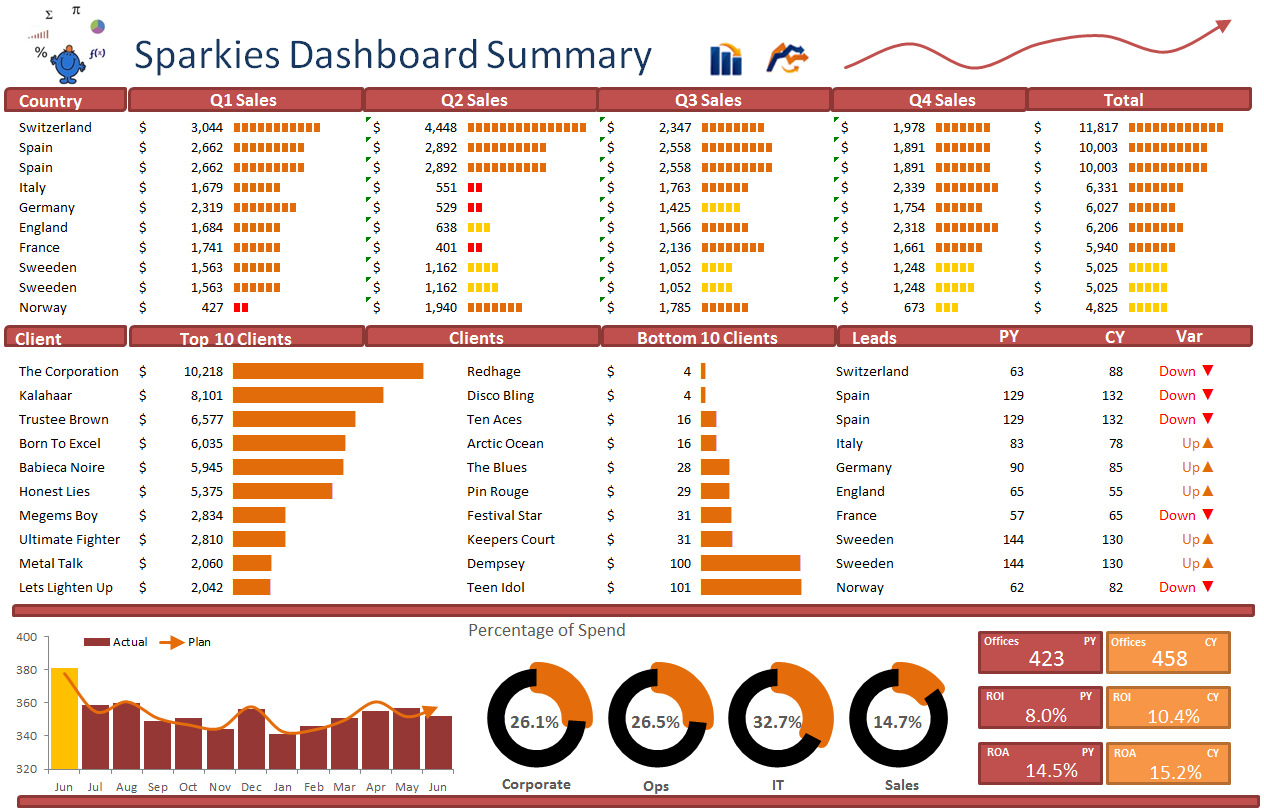
The Excel dashboard is an interesting one as it is made up of many sparklines. The Excel dashboard is arranged in financial quarters. These sparklines are not charts at all but a fudge into the world of using formatting to graphically indicate a position in Excel. The Excel dashboard works well as a visual display of each of the metrics being displayed. It is clean and clear and has conditional formatting rules to change the colour of the lines in each table. These Excel dashboards are very easy to create and maintain.
This dashboard has been updated from its original. More charts and data has been added to smooth the look of the report. It fills the space a lot better than the original.
For a listing of all Excel Dashboards on the Smallman.com visit this link. There are more Excel files than you will be able to view!!
The following Excel dashboard is outlined in the file below. The workings and formatting of this dashboard can be adapted to an endless number of situations.