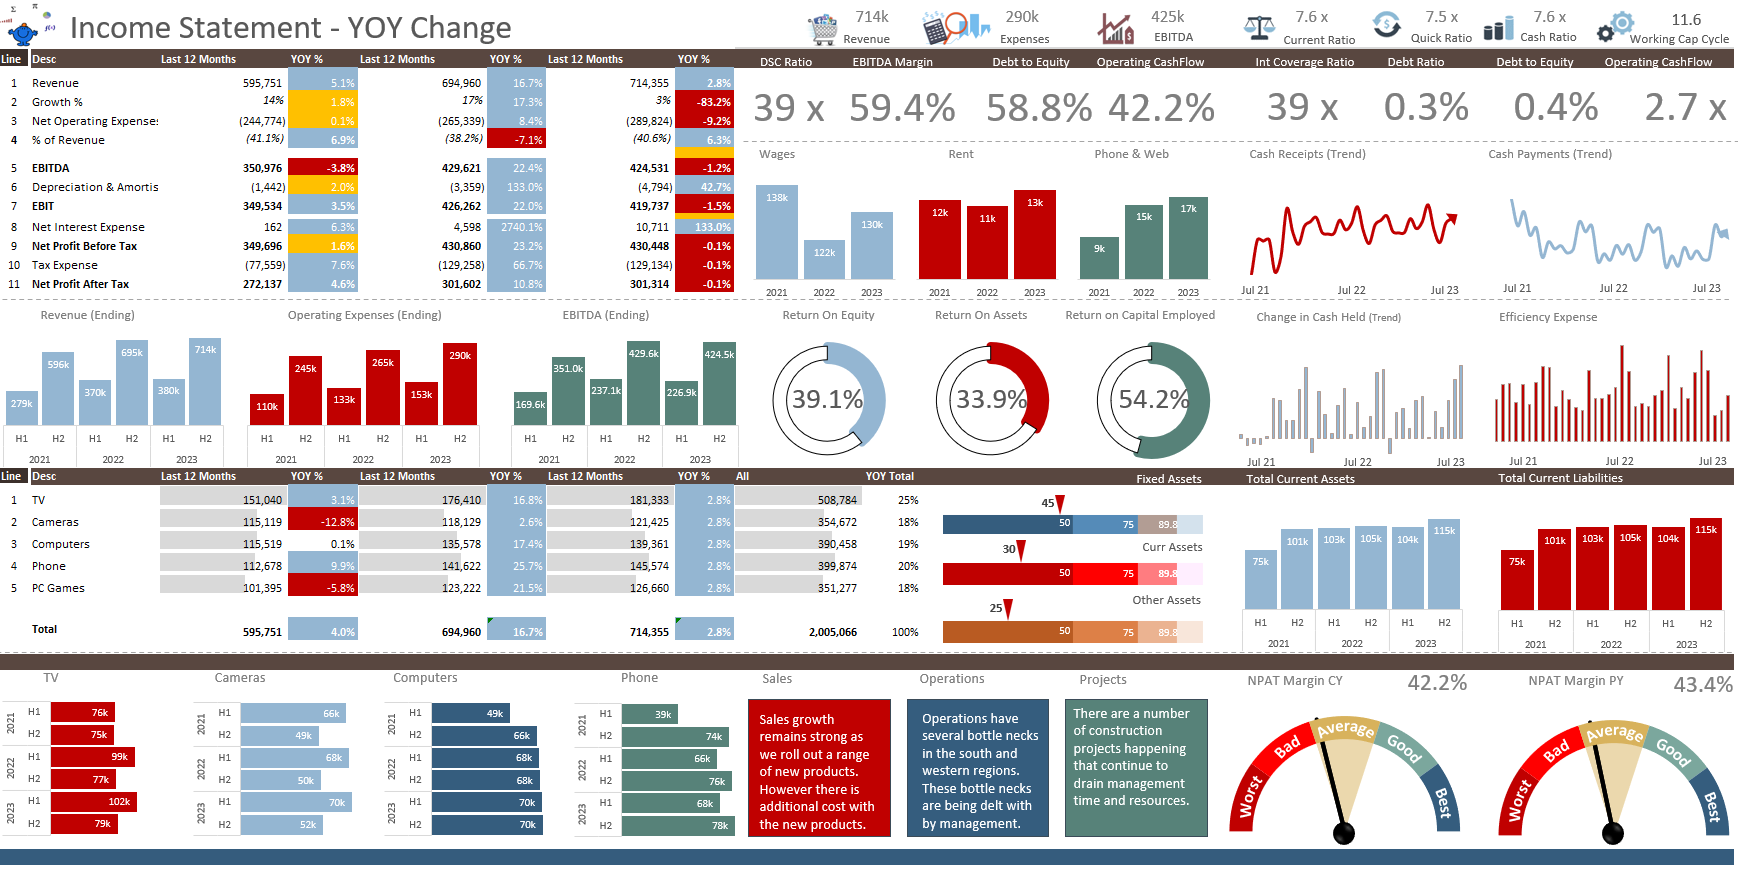
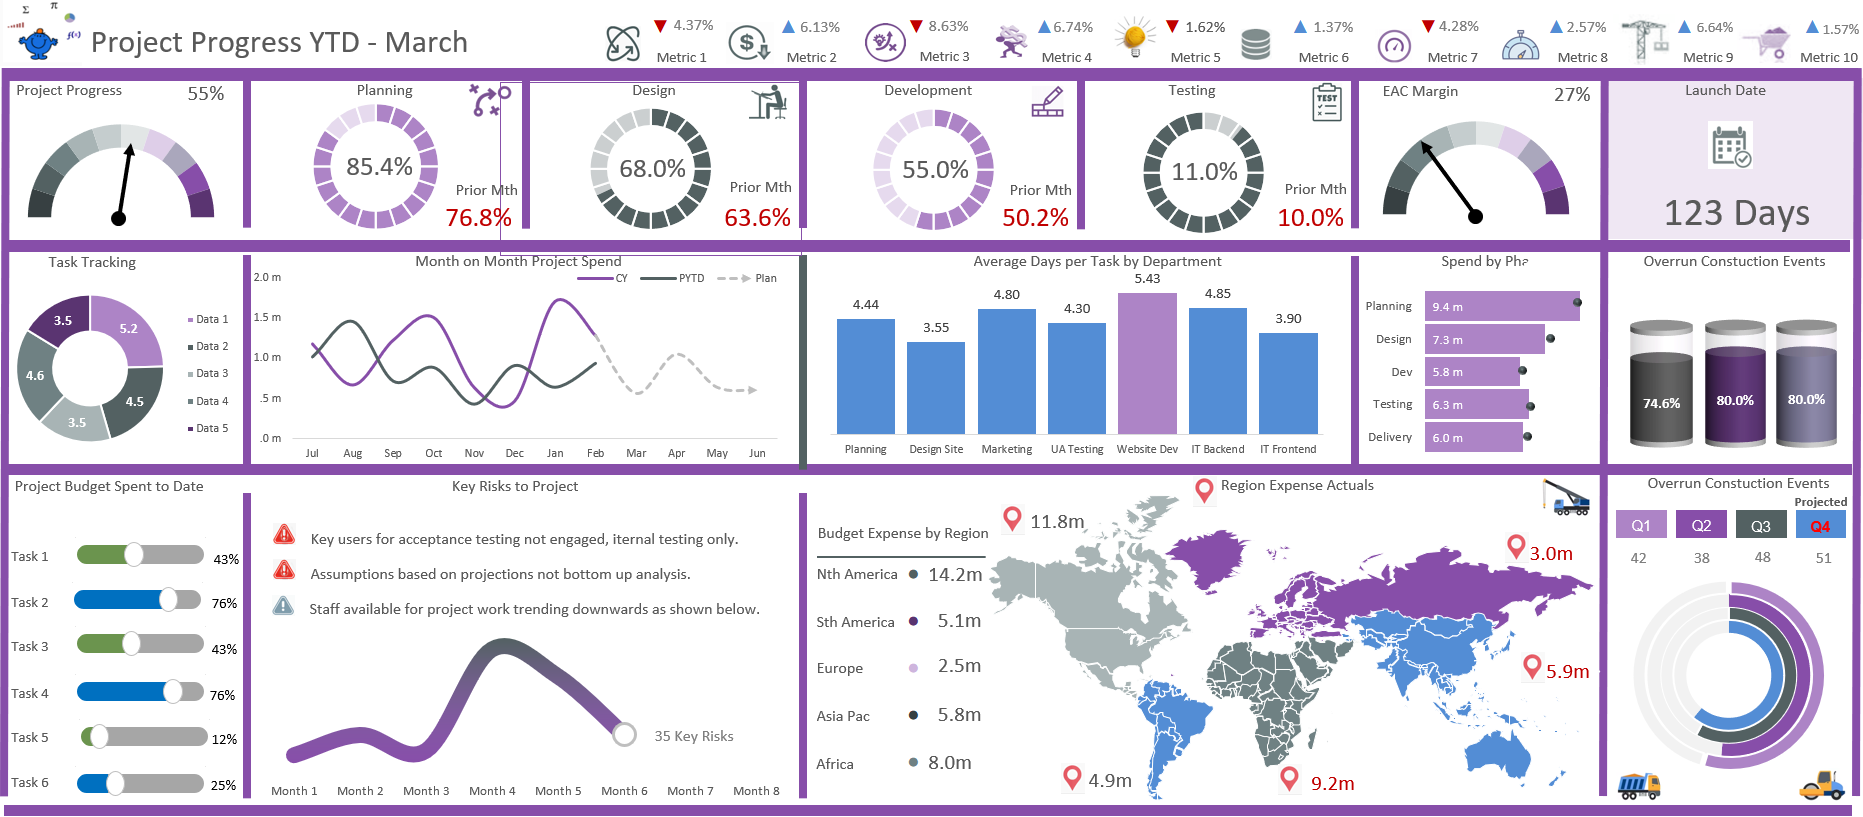
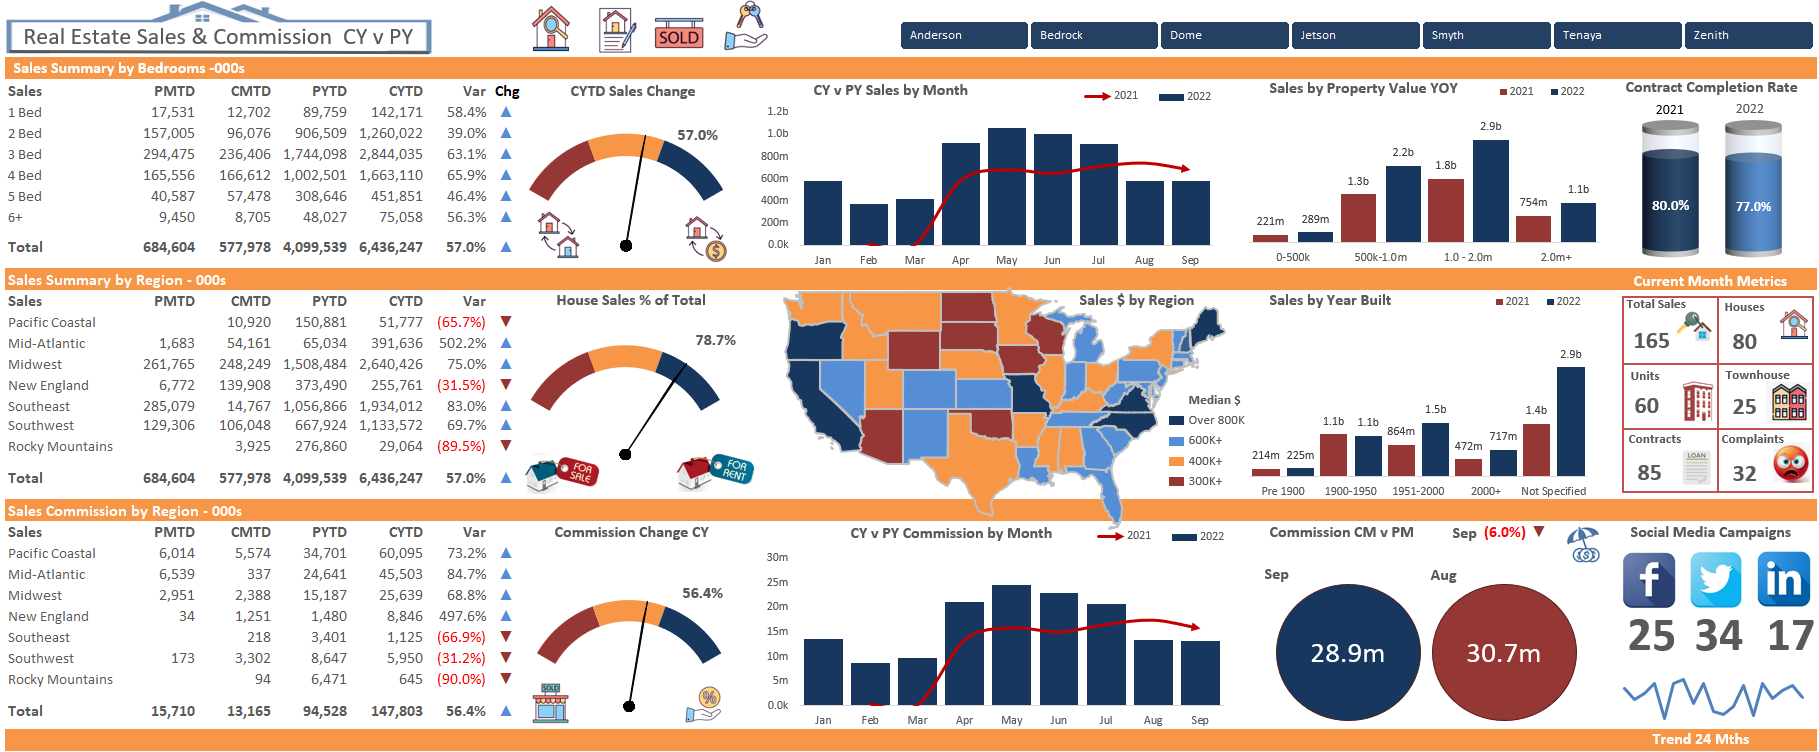
The introduction of infographics in Excel to the site has grown faster than I anticipated. The above image is just a sample of some of the infographics on the main part of the site. It has been a bit of a learning experience as I have picked up tips and tricks from the extensive online resource. I will continue to grow the infographics section until I run out of room which seems to be about 25 items in the menu. Not too far till I get there so will just add them to my blog if I ever reach that number.
Featured Posts
Recent Posts
Inflation Over Multiple Years in a Single Cell January 10, 2025
Hubspot Dashboard October 3, 2024
Monthly Dashboard With Supporting Metrics September 25, 2024
Excel Show Missing Sheet Tabs July 29, 2024
Run Macro Overnight Automatically June 24, 2024
Split File into Parts and Save to Directory April 20, 2024
Most Popular Author December 14, 2023
Creating an Excel Dashboard - A Guide with Templates December 8, 2023
Real Estate Excel Dashboard October 11, 2023
Updating Excel Dashboards September 29, 2023


