Rolling 12 month chart in Excel. Similar to techniques I have posted long ago in the charting section of the site.
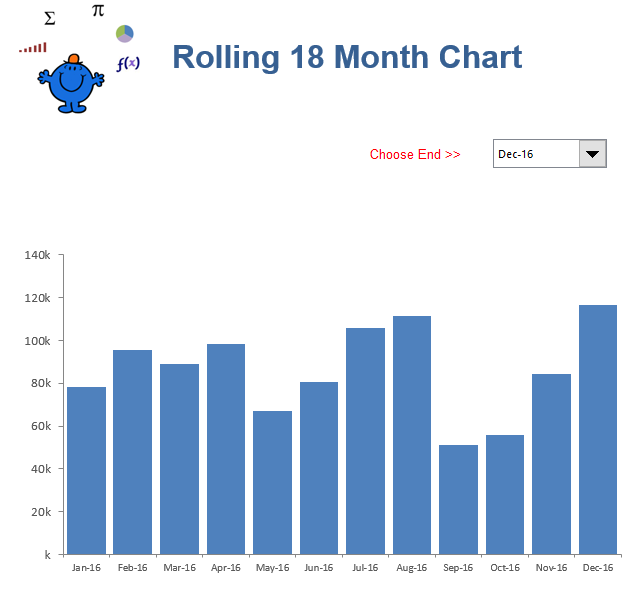
Recently I had one of my students write to me and ask if I could help with a 12 month rolling chart. I thought this might be on my site but I have similar dynamic charts but nothing specific for the task at hand. I gave the problem some thought and came up with a method for showing 12 months prior to the date chosen by a combo box. Now if the dataset has less than 18 months’ worth of data then the chart will show less and less data.
=OFFSET(Data!$N$11,Data!$C$38,0,IF(Data!$I$10>Data!$F$38,Data!$F$38,Data!$G$38))
In the midst of the formula – there is a reference to 12 (Bold text). This is where I have included an IF Statement which will either choose 18 months or 12 months less the months which are available in the dataset. This has the effect of the chart being either 12 months or a shrinking range from 12 to 1 month in the chart.
When setting this technique up is it most important to set the range for the dates (or description) and the values which go with it.
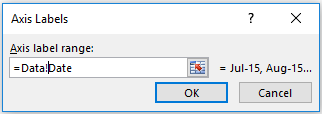
Where the Date is the named range which is of course dynamic. Data! is the name of the worksheet and Date is the name of the range. Together:
Data!Dates
Remembering to include the exclamation point. Follow the same technique for the values.
Notice the reference to Vals which is the dynamic range for the figures.
The beauty of this technique is you can change the reference from 12 to whatever you wish and the chart will update accordingly. The following is an example of the technique with a combo box which works in conjunction with the chart.


