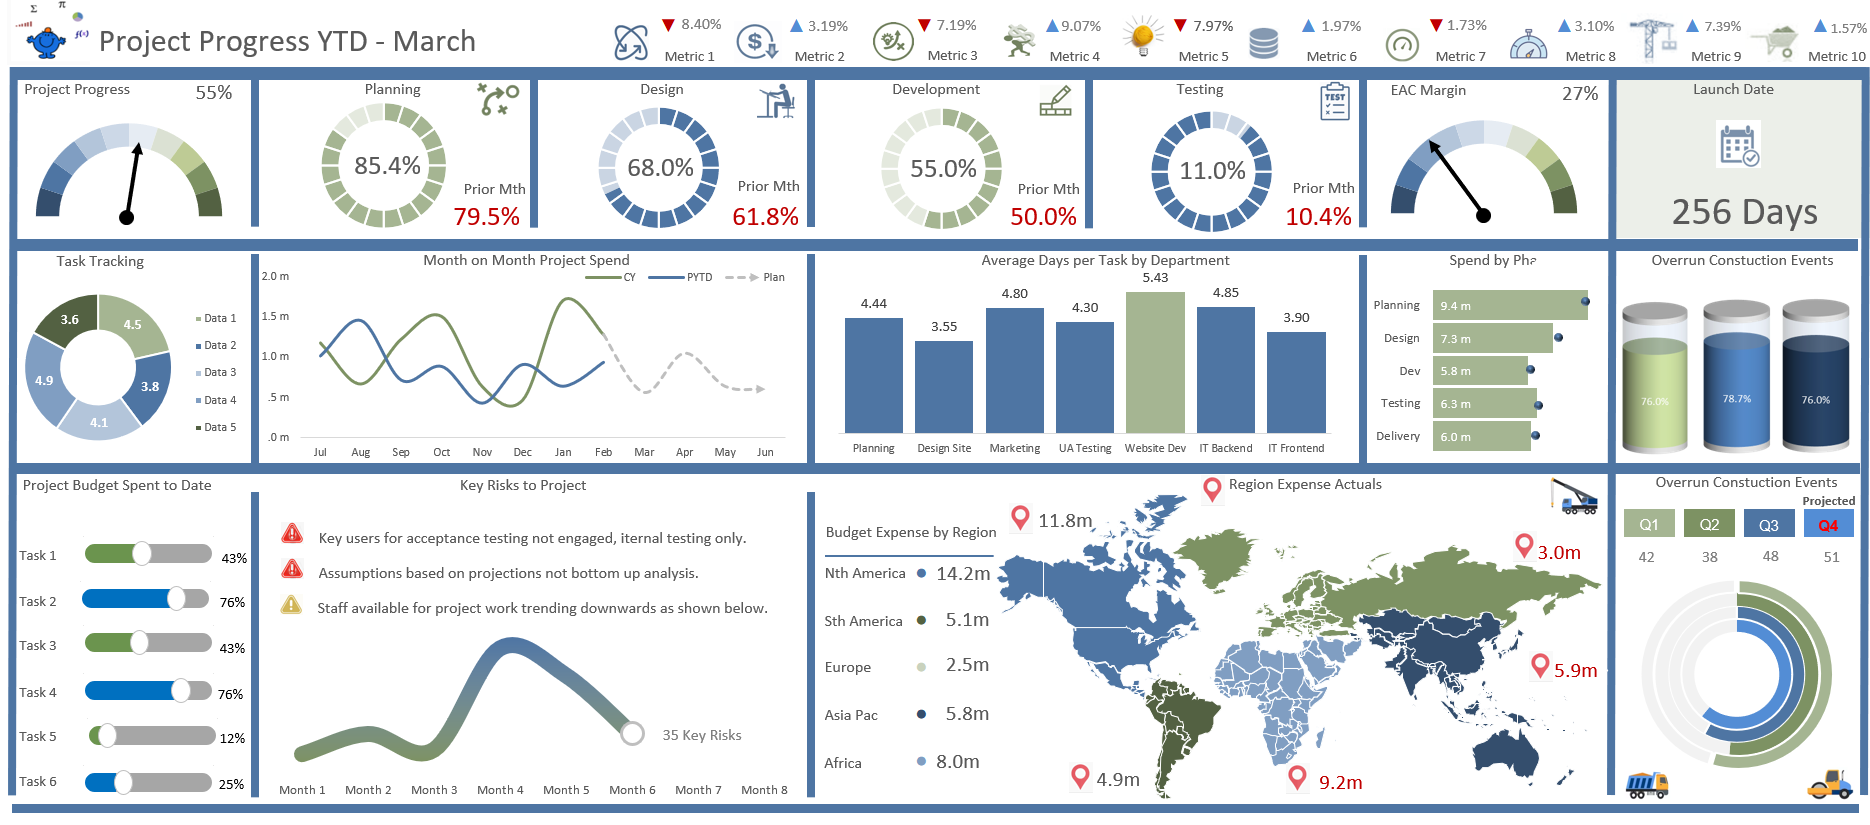
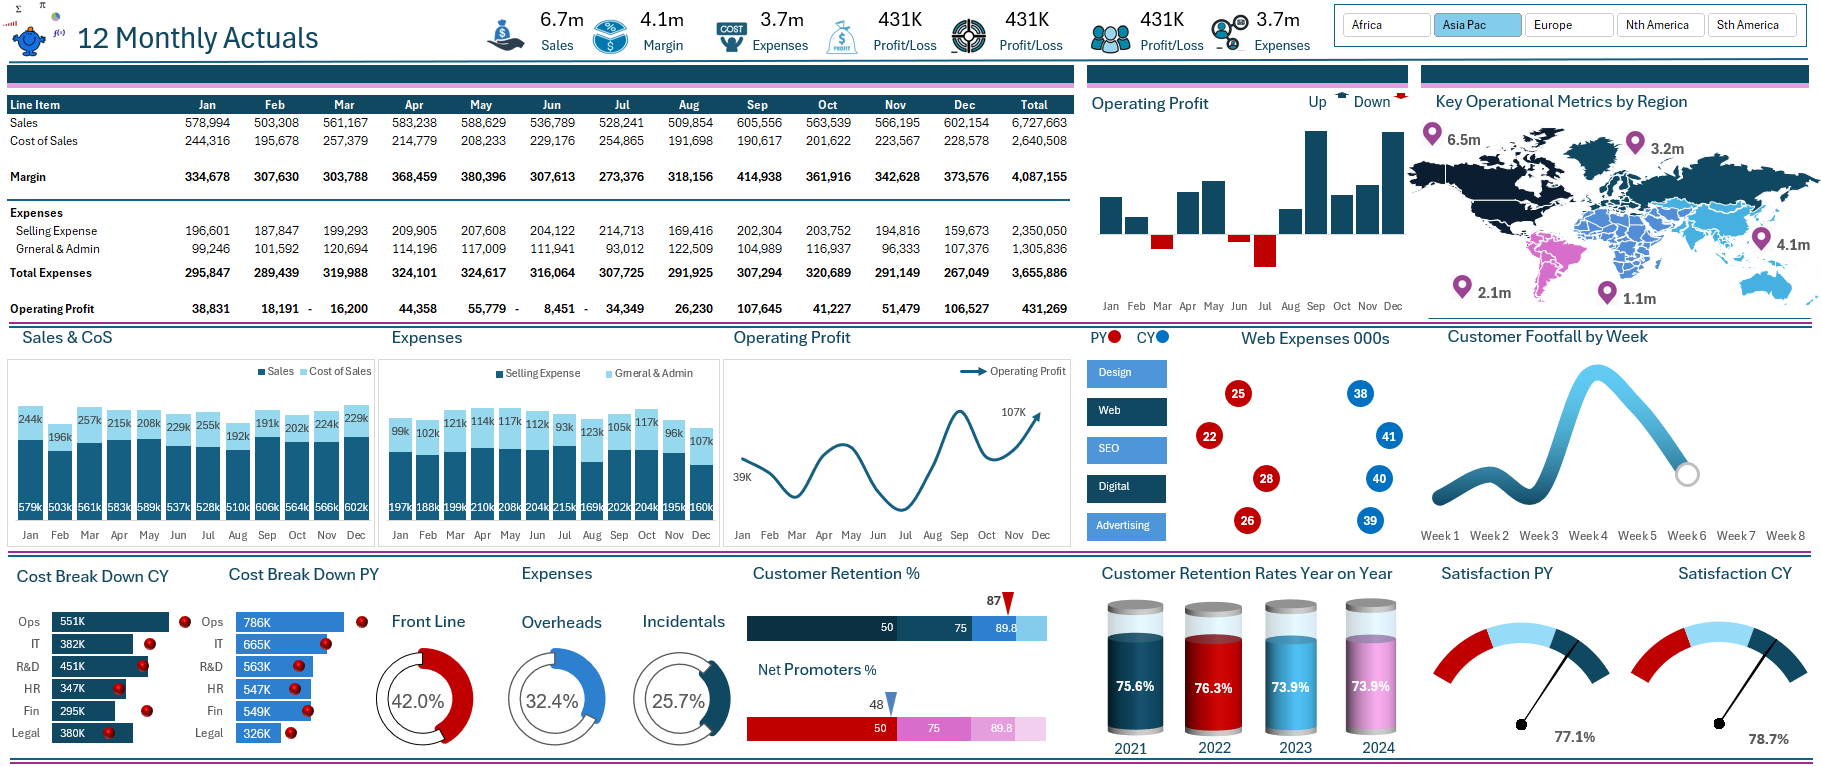
A project dashboard if done well is a highly visual representation of key project metrics that allow project leaders to monitor and track progress over time. The dashboard provides a helpful overview of the overall status of a project.
Project tracking dashboards typically focus on actual versus budget, resource allocation, key risks, completion rates and a range of other metrics. They can flag when parts of a project are going poorly and help with the maintenance of the project as much of the information is right there in front of you. The project dashboard helps inform and if done thoughtfully will add a great deal to any business. These reports can be updated in real time , enabling project managers to monitor progress and make data driven decisions throughout the projects lifecycle.
The key project metrics are displayed at the top and the detailed metrics are beneath. Order the data so that the key data is displayed prominently. This way the user absorbs what is most important and the detail adds to the experience.
These type of dashboards are fun to create as projects usually come with much scrutiny and having a one page report that describes what is happening at a given point in the project is useful on a number of levels. Try creating your very own project tracking dashboard, an example output is here to help.


