Key Measures Excel Dashboard
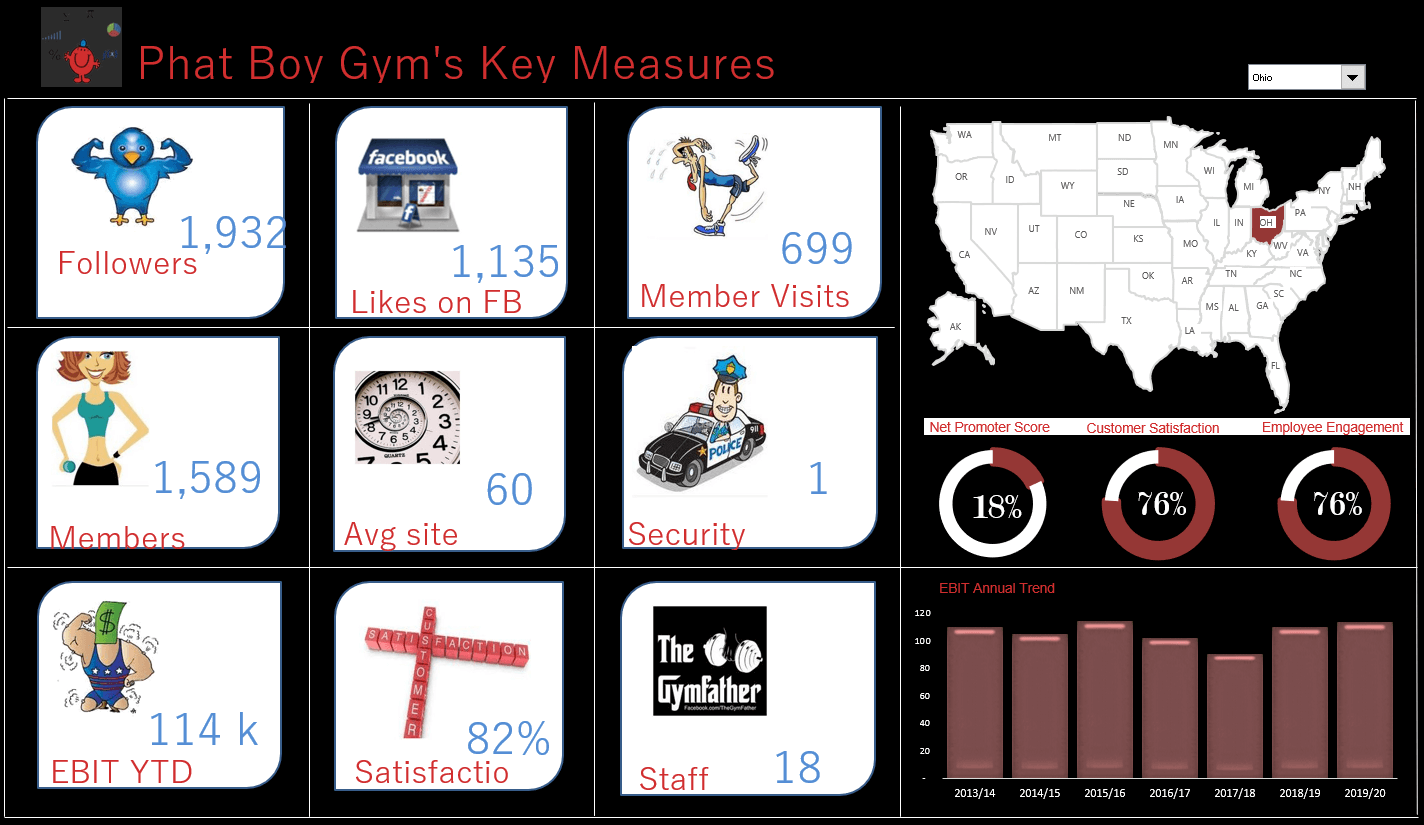
The following Excel dashboard represents is an American chain of gyms, it displays key organisational data in a visual way. Phat Boy's Gym, a fictional gym which shows key metrics for each city. It displays key information for each location and dashboard will change based on the drop down on the top right of the screen.
This is one of the dashboards I have enhanced. I added the right part of the dashboard including an Excel Heat Map. The heat map will colour the State maroon which is selected in the drop down at the top right of screen. I have numerous heat maps on thesmallman.com. You can read more about heat maps and find out how they work by looking at this link.
For a listing of all Excel Dashboards on the Smallman.com visit this link. There are more Excel files than you will be able to view!!
The attached file is the Excel dashboard which contains all of the workings. The dashboard should be quite easy to follow.


