
USA Population and Employment Excel Dashboard
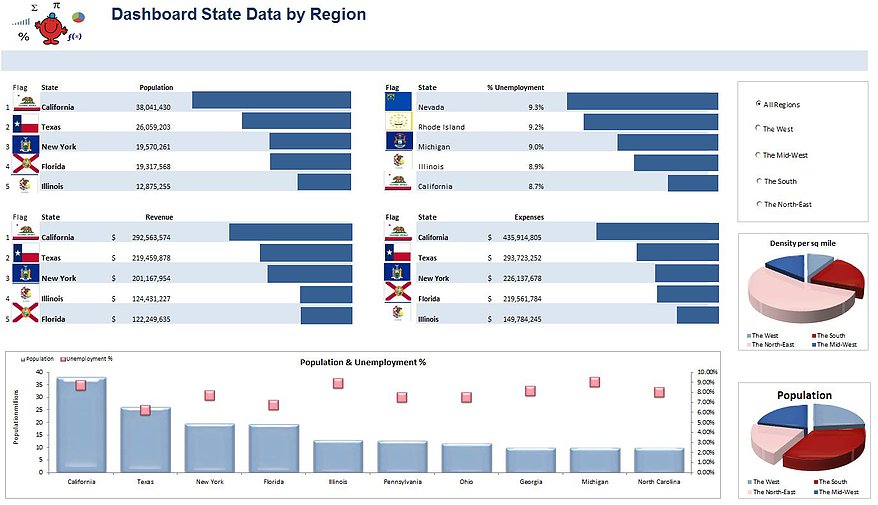
The following Excel dashboard is a look at population metrics obtained from Wiki. Pictures change as the Excel metrics change. At the right of the dashboard there is some radio buttons which enables the selection by region. The States are grouped into their regions and as the grouping is selected the State flags and charts change in accordance with the choice. The metrics in this dashboard is primarily top 5 by State.
For a listing of all Excel Dashboards on the Smallman.com visit this link. There are more Excel files than you will be able to view! Excel dashboard creation should be fun and creative, be consistent with your colours, try to align elements of your dashboard, group like items together to ensure flow and get others involved in the process. Group think always produces a more informed outcome.
The following Excel dashboard is an Excel macro enabled workbook. It uses vba to run the dashboard as a result of the active X radio buttons on the right of the dashboard.
